Microeconomics Study Guide (Unit 4)Imperfect Competition
General Concepts
Profit Maximizing Rule
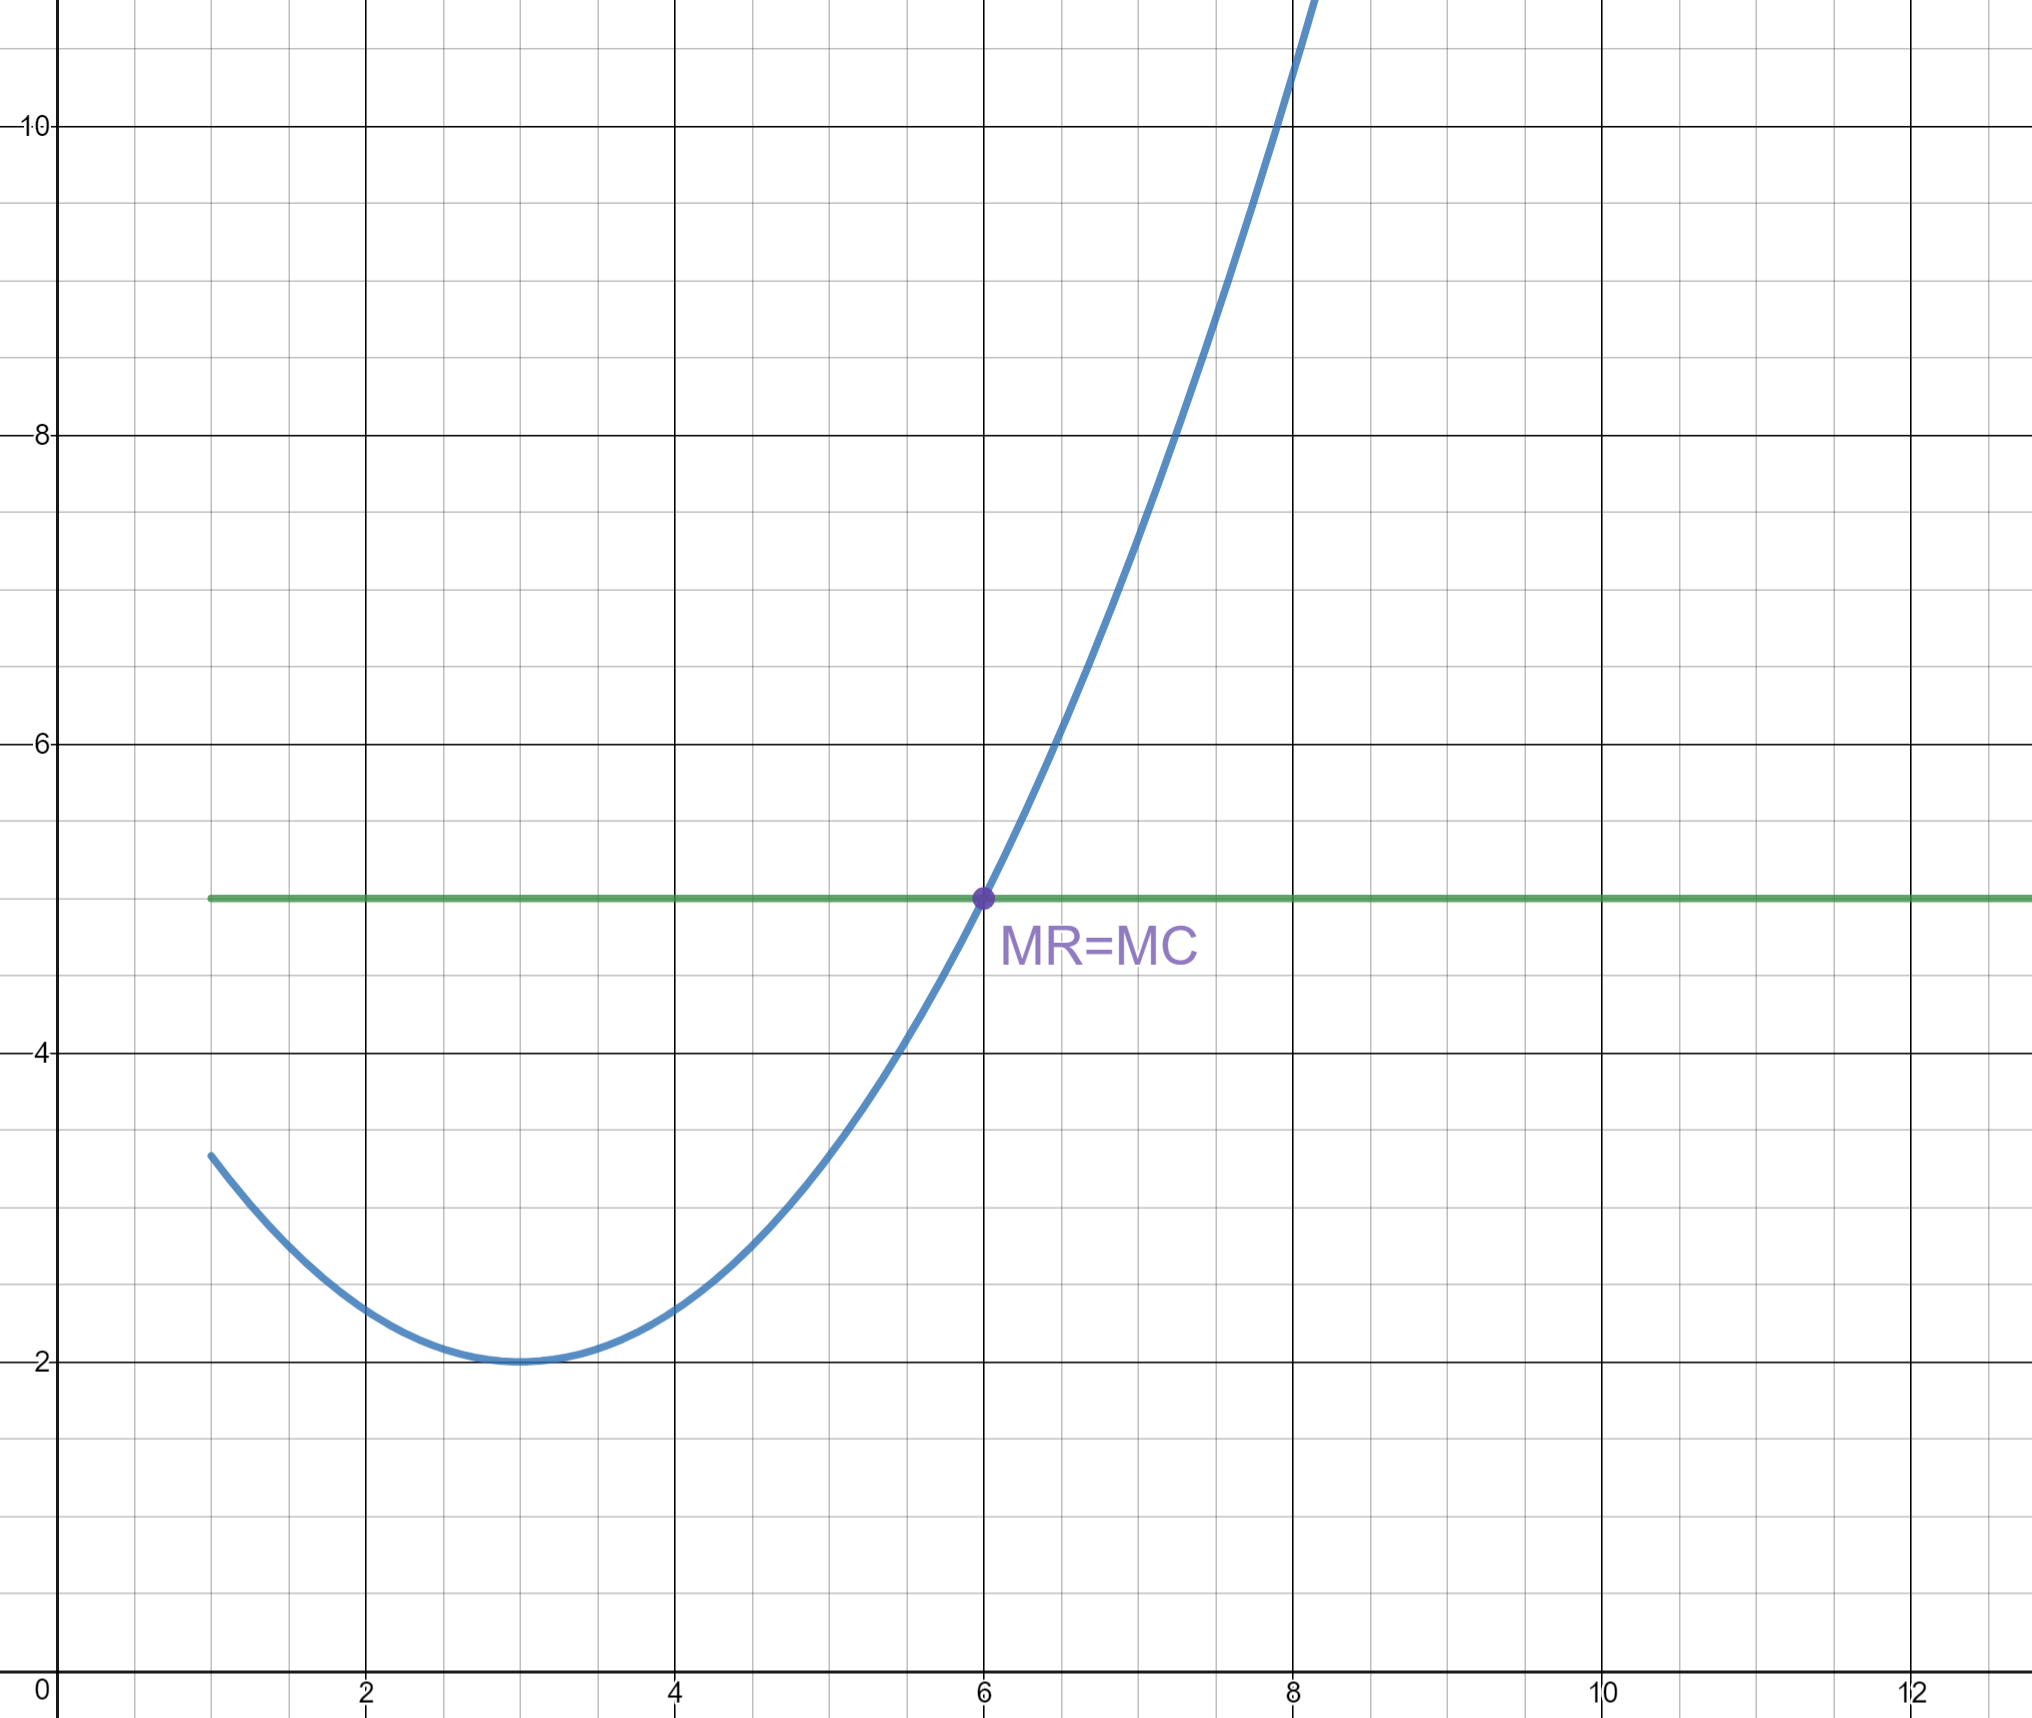
ALWAYS when Marginal Revenue is equal to Marginal Cost (MR = MC). This point determines the quantity that the firm should produce and the price it should sell at to maximize profits. Keep in mind that this price and quantity will not always be beneficial for society, especially when considering monopolies.
Using perfect competition as an example, noting that the green line is Marginal Revenue and the blue line is Marginal Cost, the point where they intersect is the Profit Maximizing Point (MR = MC).
Short-Run Supply Curve
In the short run, the Supply curve is the same curve as the Marginal Cost curve above it's Average Total Cost curve intersection. This is such because the Supply is dependent on the cost of production, or Marginal Cost.
Shut-Down Point
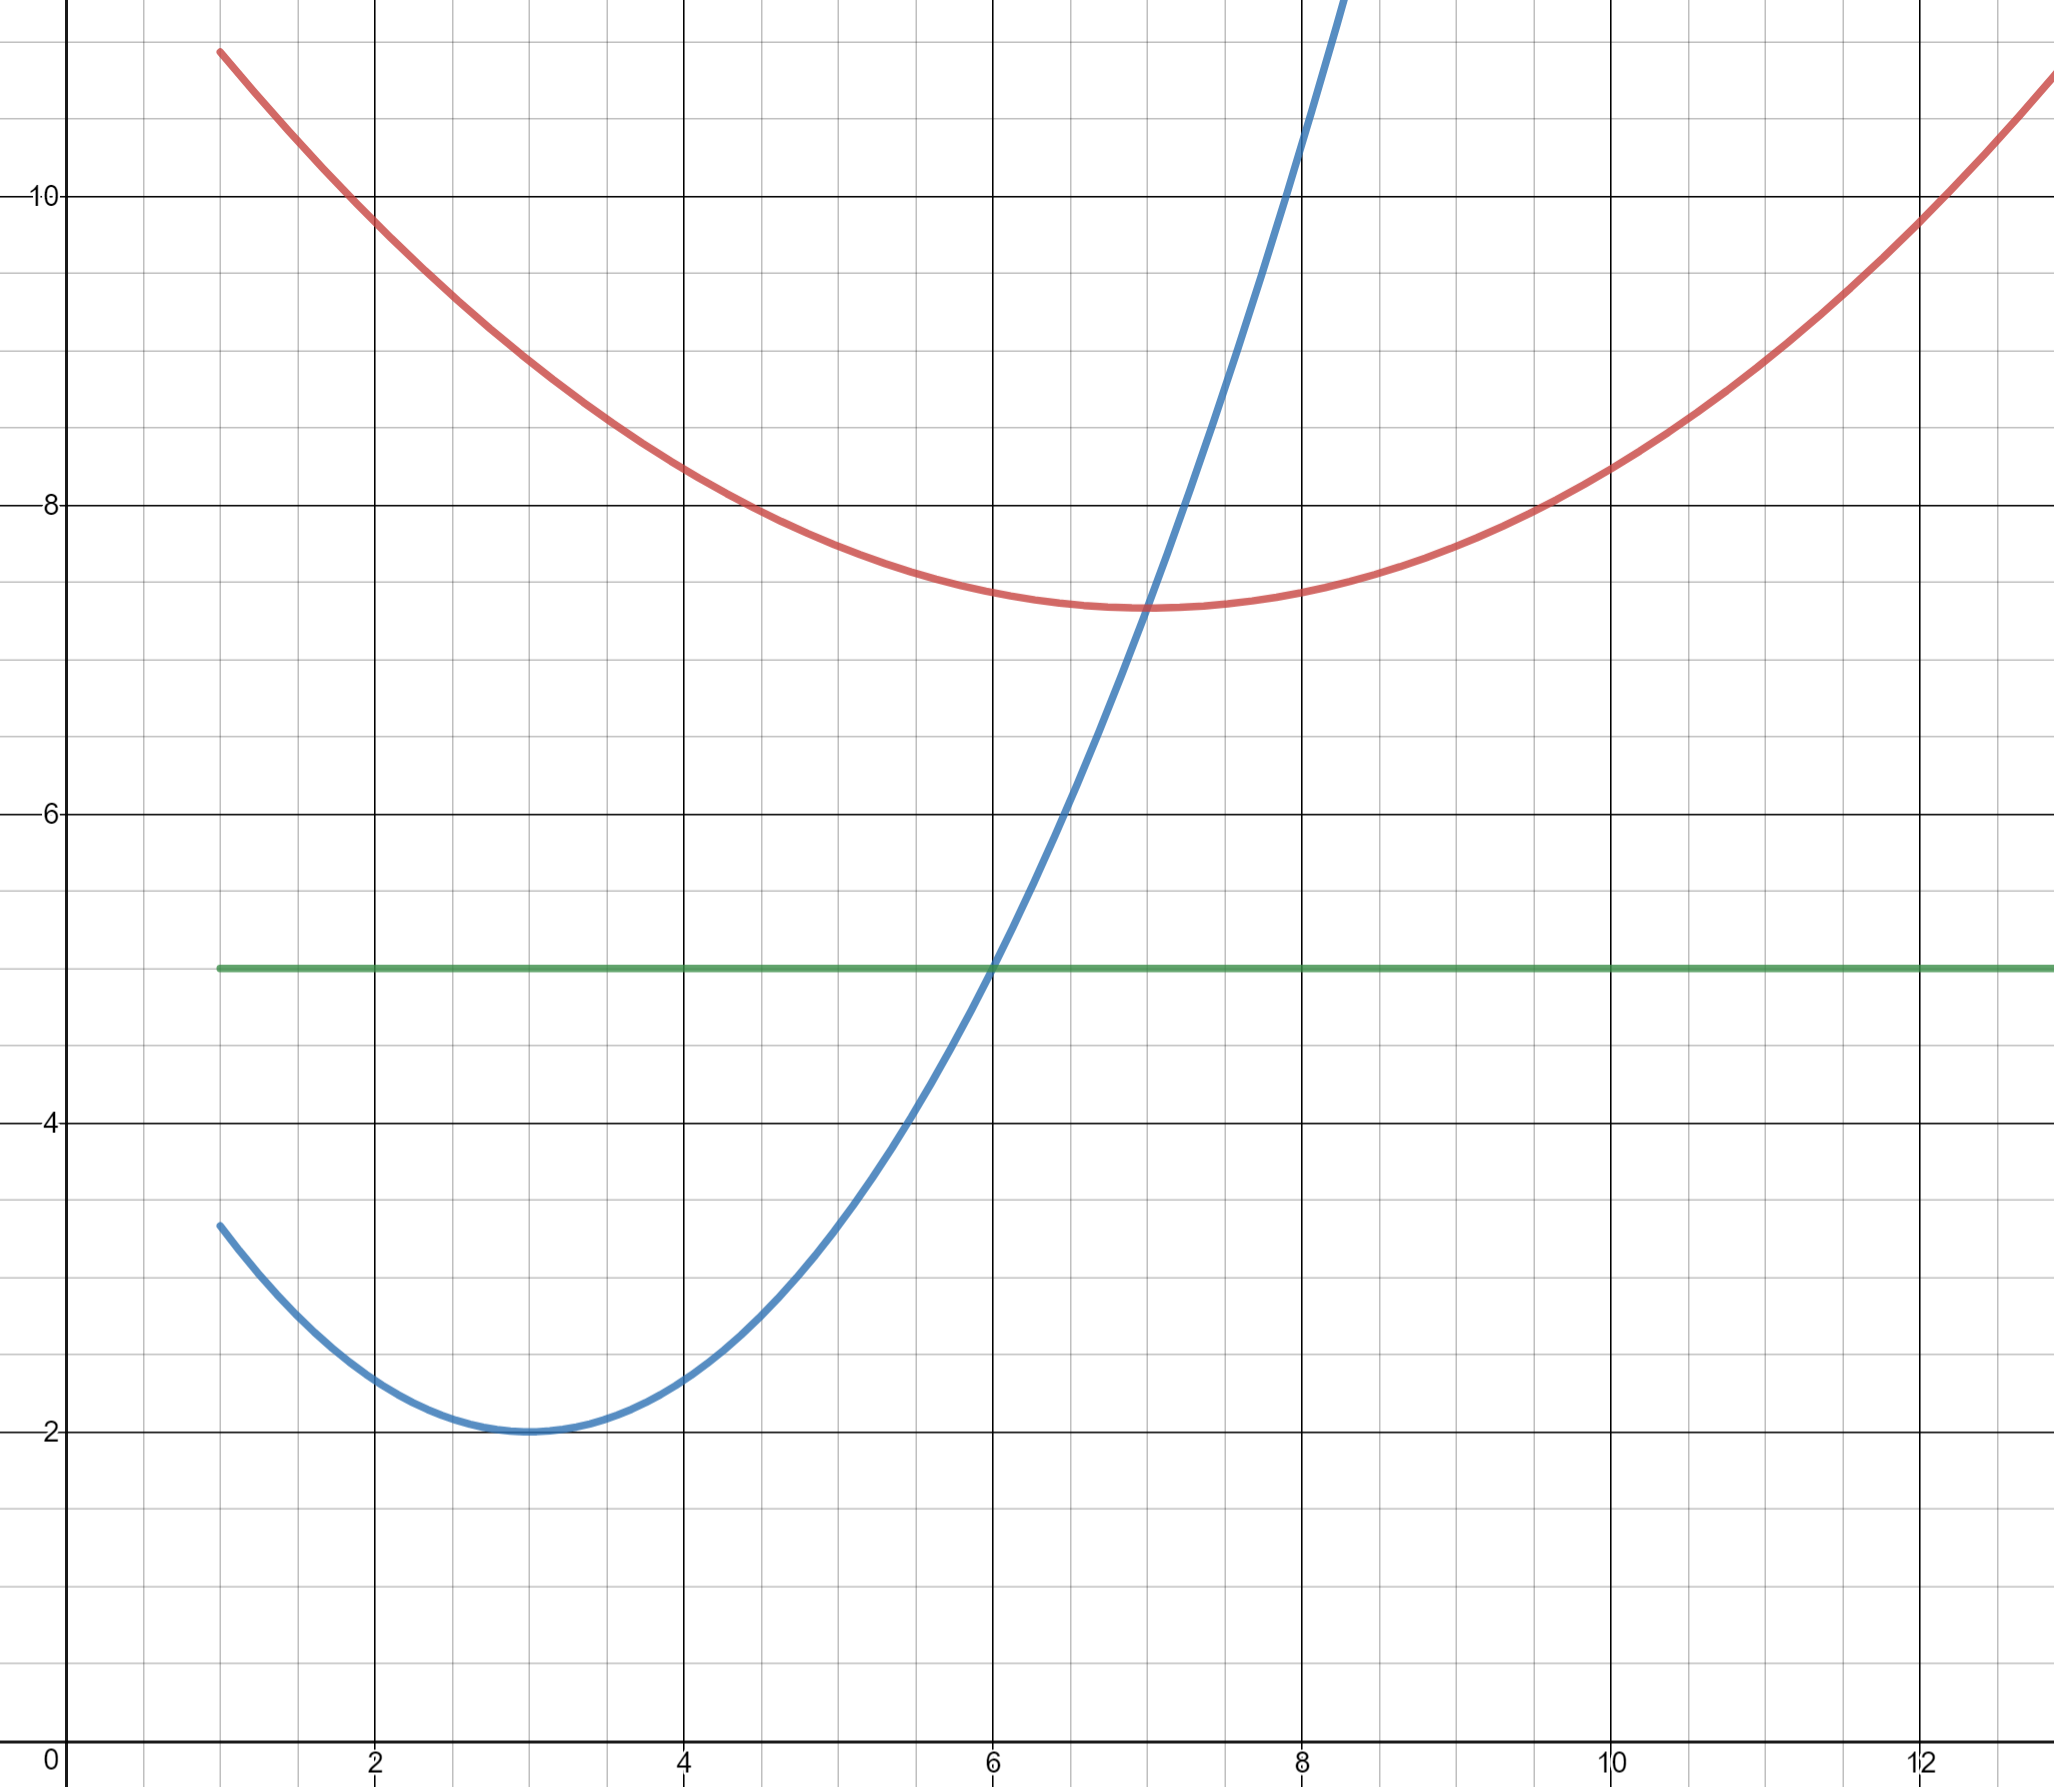
If the firm is not making enough revenue to sustain, it must shut down in order to avoid even larger losses. At this point, it's much more beneficial to just stop production than to continue producing at such a loss. It can be seen on the graph at the point where Marginal Revenue and Average Variable Cost intersect (MR = AVC). In essence, if Price is lower than Average Variable Cost at the Quantity being produced (P < AVC), then the firm should shut down.
Using perfect competition as an example, if Price/Marginal Revenue is less than Average Variable Cost, then the firm is at too much of a loss for it to make sense to continue operating.
Productive Efficiency
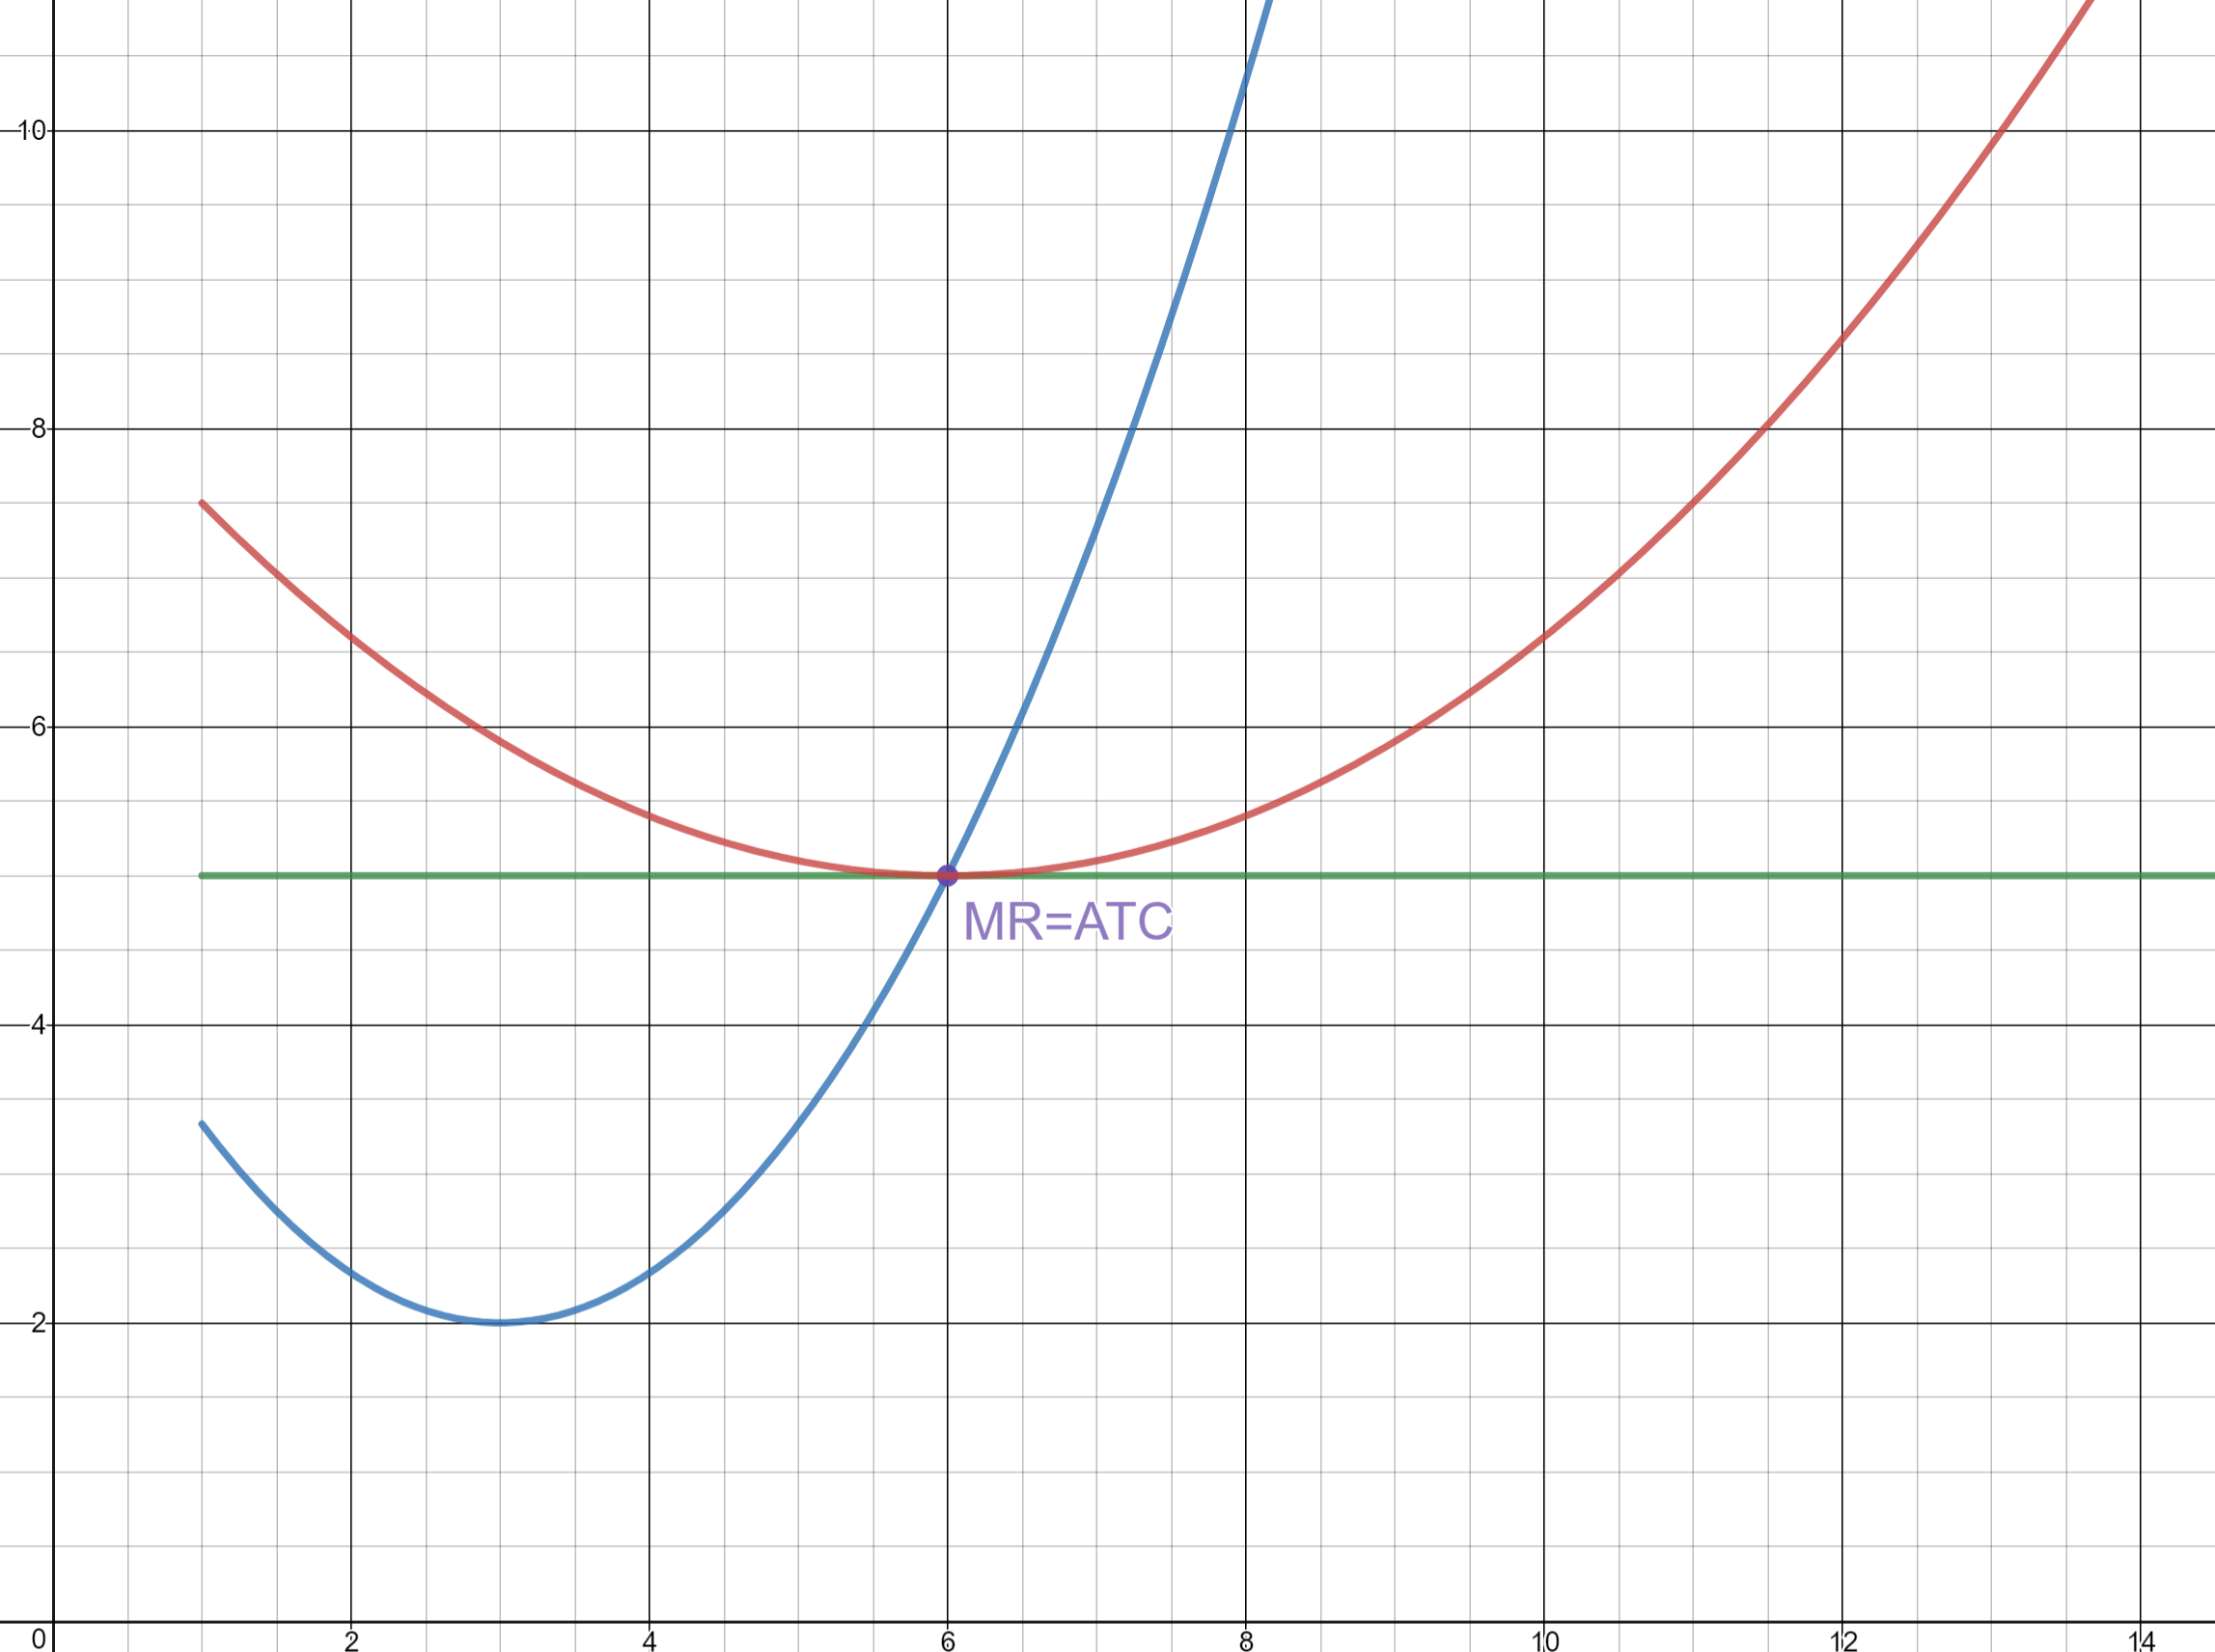
Productive Efficiency is the quantity at which a firm can produce for maximum efficiency. Also seen as the Fair Return point, it can be found at the quantity where Marginal Revenue is equal to the Average Total Cost (MR = ATC). That quantity also determines price, but Productive Efficiency does not produce Profit, so it is usually avoided, especially by monopolies and oligopolies. Perfect and monopolistic competition always ends with Productive Efficiency in the long run, as firms are able to enter and leave with ease, which heavily alters the industries production potential to match what society always wants.
Using perfect competition as an example, this firm is at Productive Efficiency because the Marginal Revenue is equal to the Average Total Cost, meaning that it the most the firm can produce without attaining a loss.
Allocative Efficiency
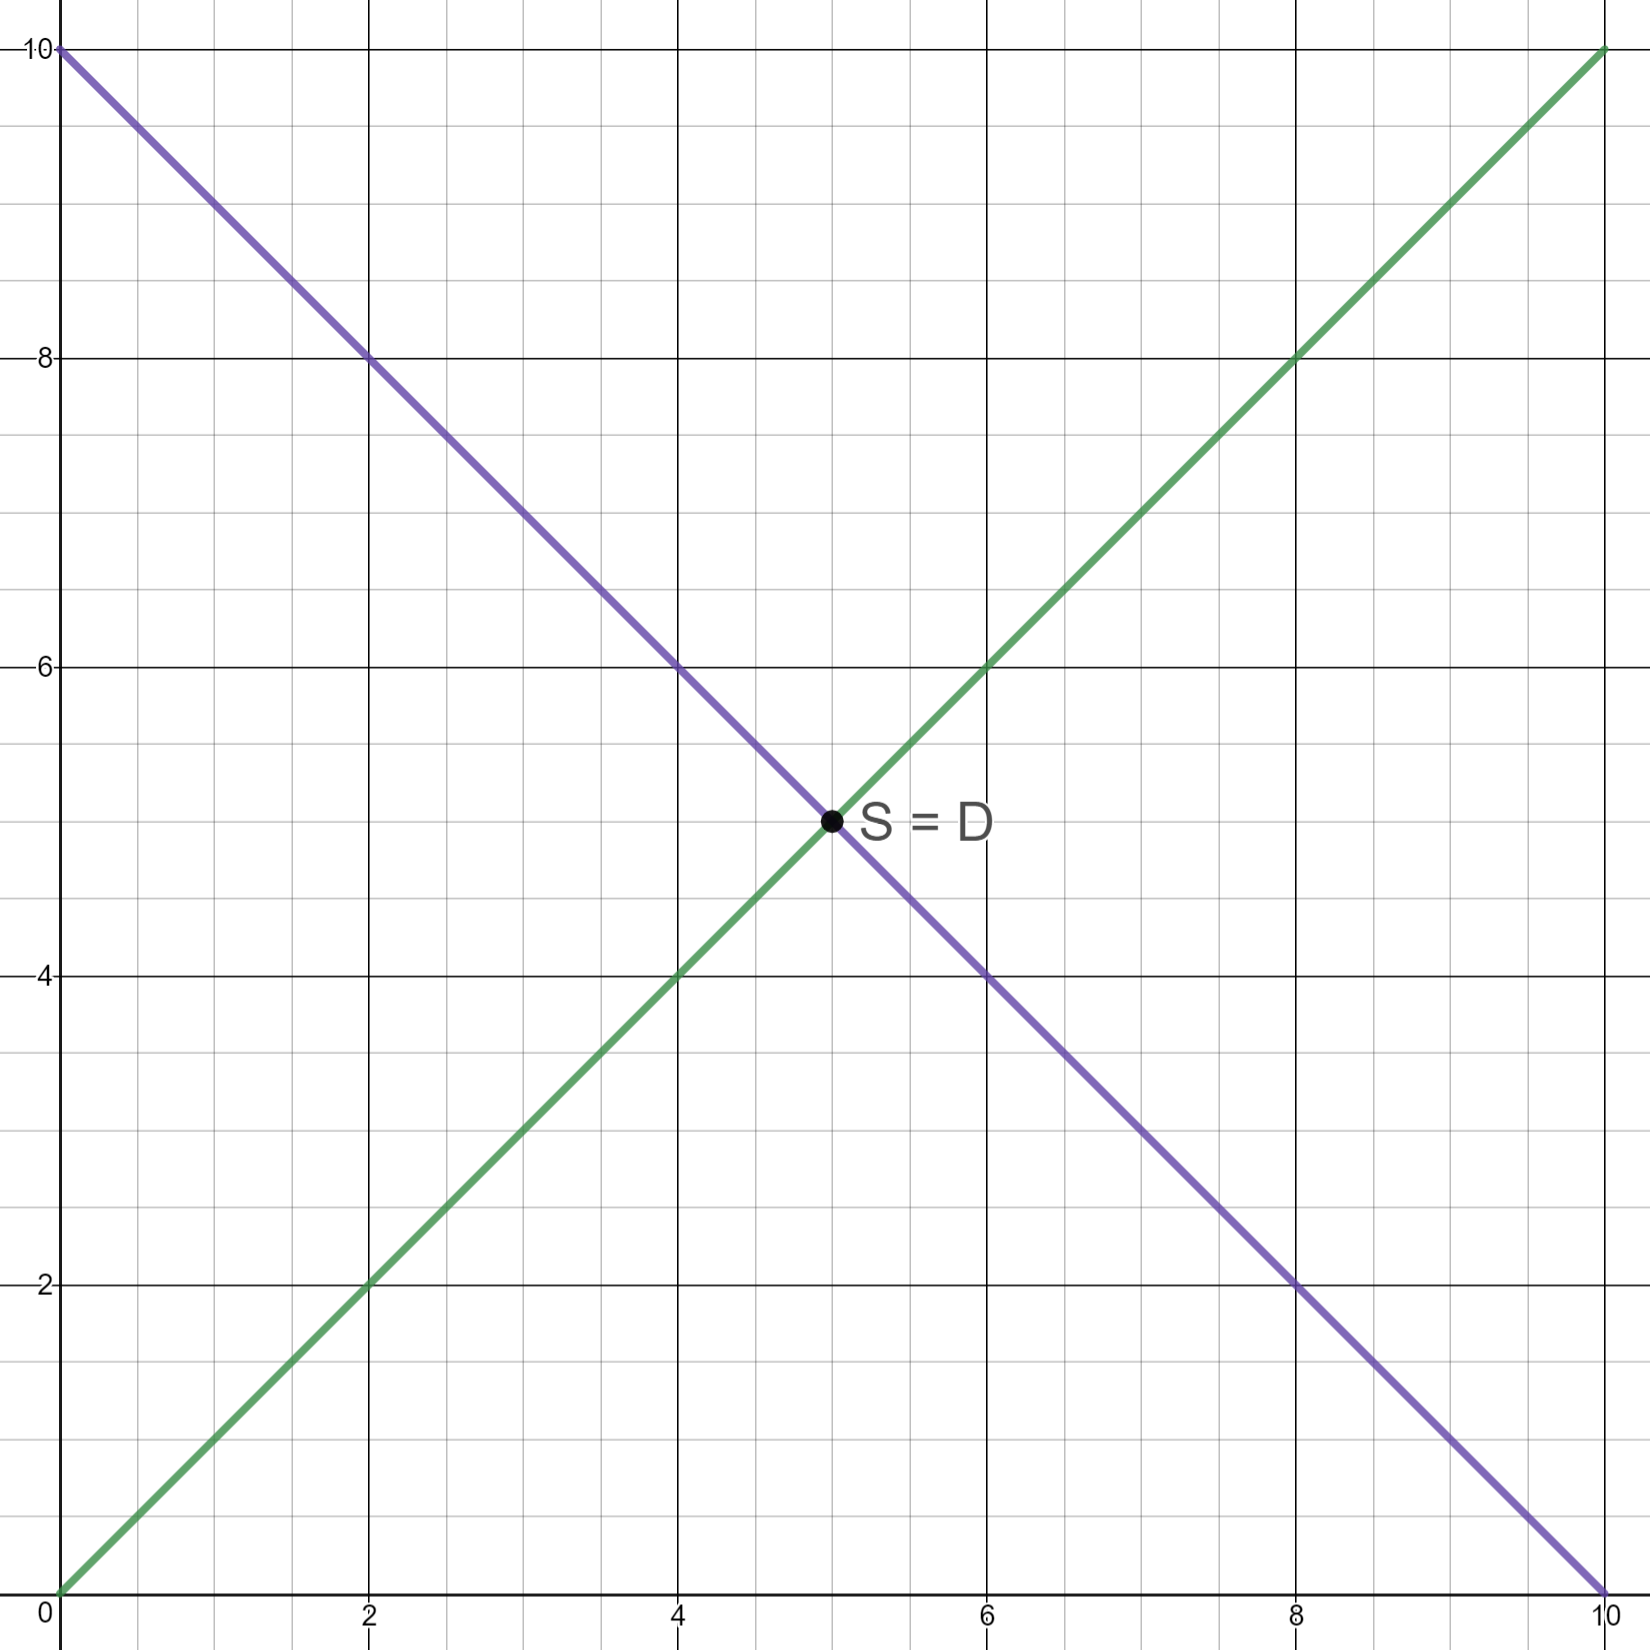
The most efficient quantity a firm can produce that satisfies society. Generally, for monopolies and monopolistic competition, this is avoided. Allocative efficiency is achieved when Marginal Cost or Supply is equal to Demand (MC or S = D).
In this perfect competition industry, the intersection between Supply and Demand is the point of Allocative Efficiency, as it's where there is enough Supply to satisfy Demand. Too little Supply and society is not happy, and too much Supply and the industry/indivudual firms are being inefficient.
Excess Capacity
Excess capacity is when a firm is producing a quantity that is less than it can potentially produce or less than what is optimal for society. This creates scarcity, which allows imperfect competitions to raise prices. Can be seen on the graph between minimum Average Total Cost (ATC) and the Profit Maximizing Point (MR = MC).
Key Graphs
Costs of Production
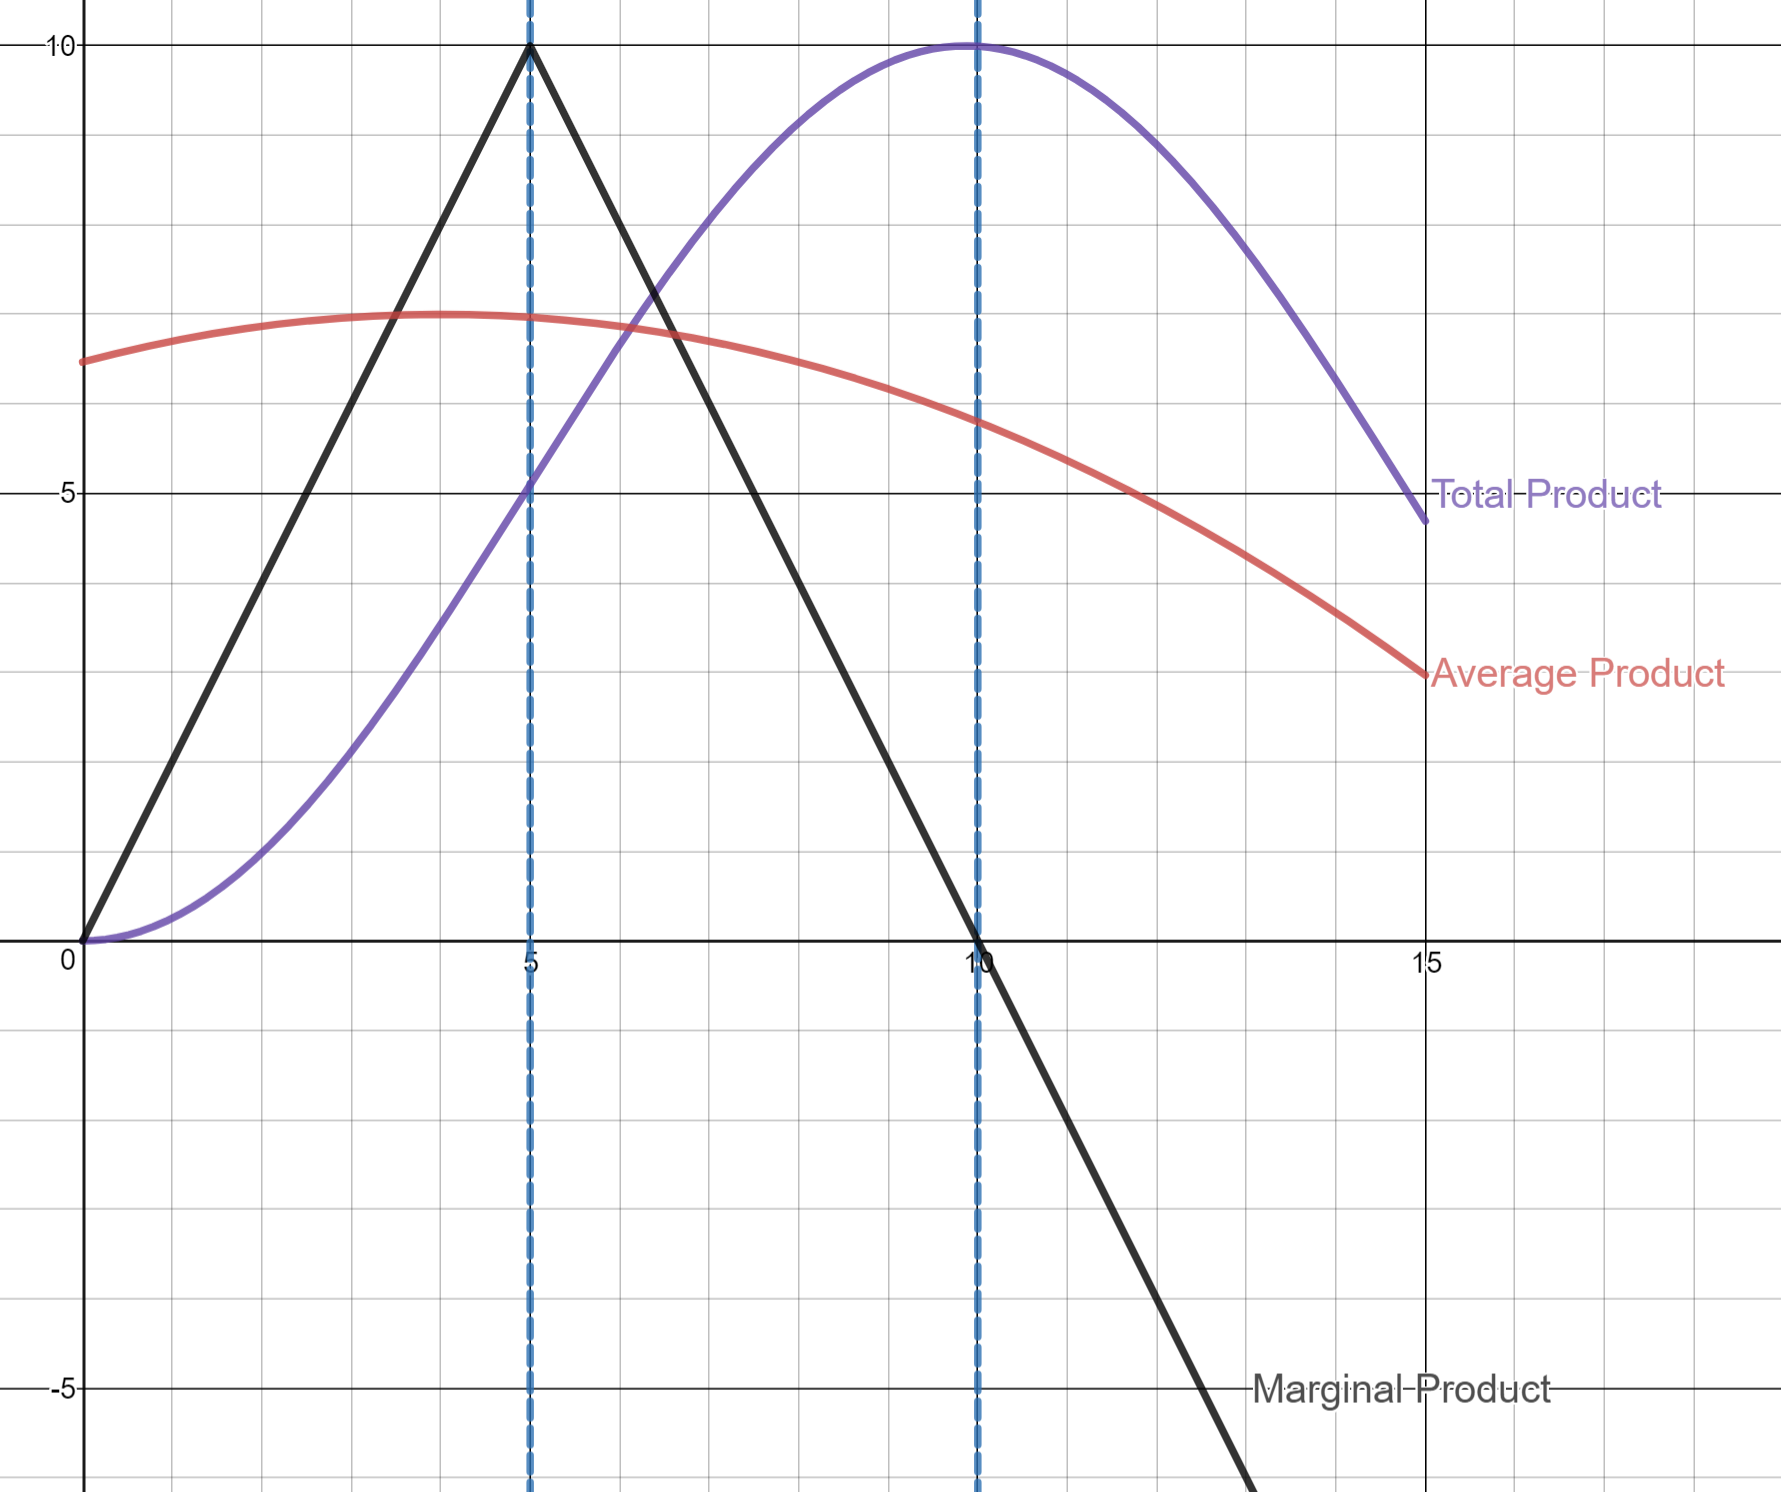
The Production Function represents the Total Product, Marginal Product, and Average Product. It is comprised of 3 stages:
Stage I
Stage II
Stage III
Total Product
Increasing Increasing rate
Increasing Decreasing rate
Decreasing
Marginal Product
Increasing
Decreasing
Negative
Average product starts off increasing, but decreases as more product is made.
TC=Total Cost=FC + VC VC=Variable Cost, increases FC=Fixed Cost, does not change MC=Marginal Cost ATC=Average Total Cost=TC / Quantity AVC=Average Variable Cost=VC / Quantity AFC=Average Fixed Cost=FC / Quantity
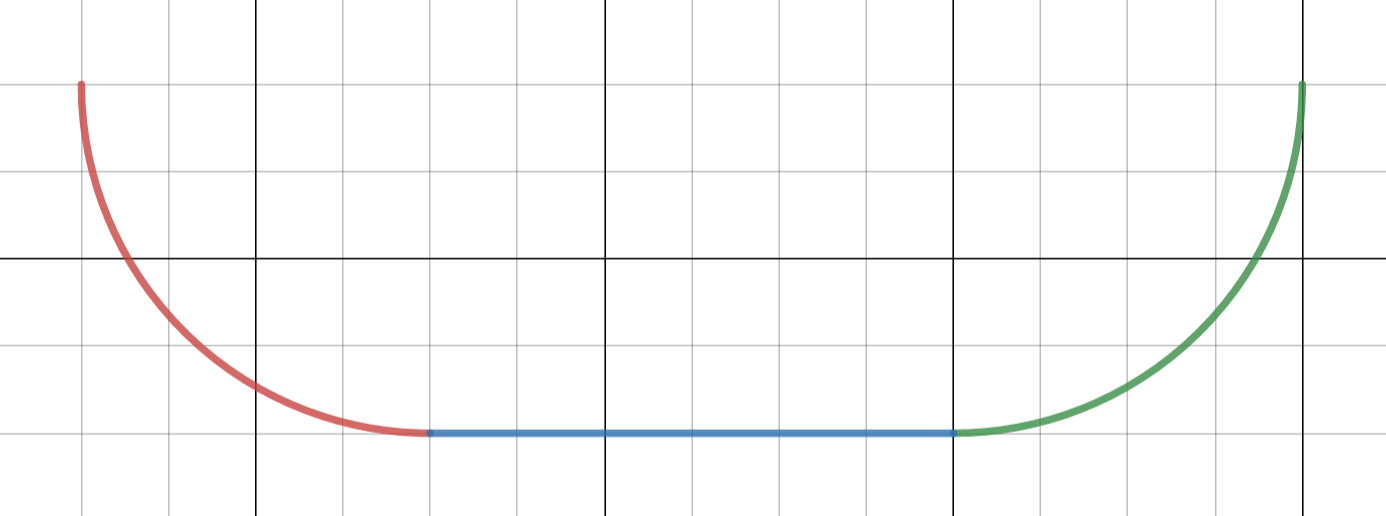
The long-run ATC curve also has 3 stages
Where X is output and Y is ATC, the first part has ATC decreasing because of economies of scale--production is being specialized. It then stays flat from constant returns to scale, then Average Total Costs start to increase due to diseconomies of scale.
Perfect Competition
- Identical products
- Marginal Revenue = Demand = Average Revenue = Price
- Price taking firms
- Large number of firms (~1000)
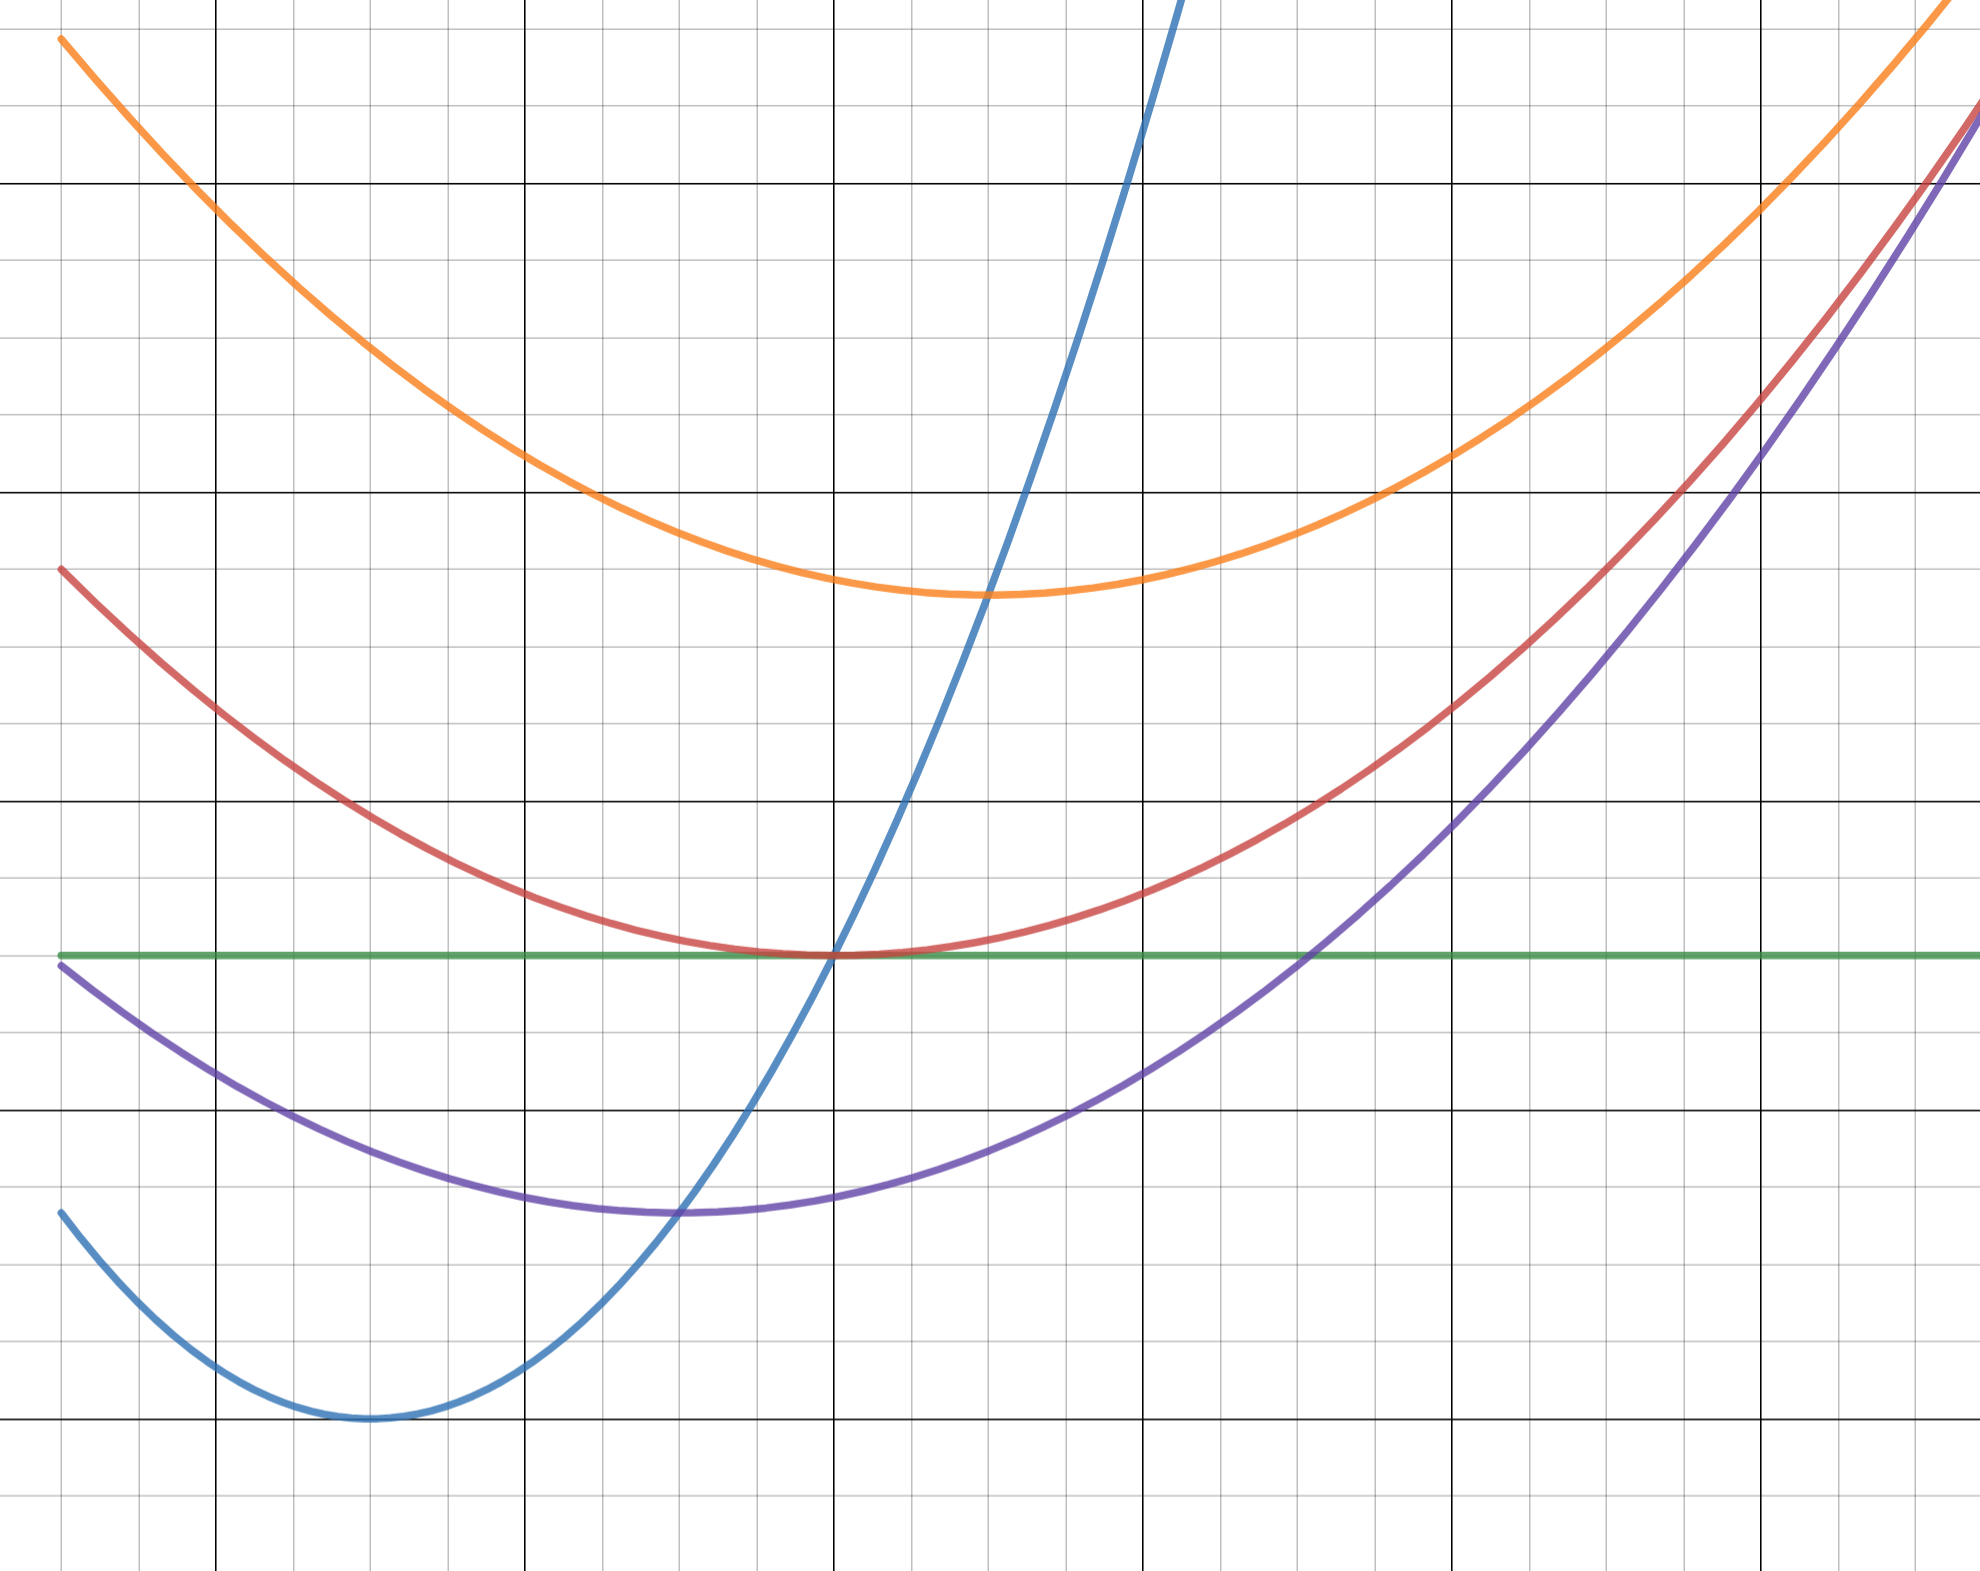
On this graph, the Purple ATC curve shows a profit because the price is greater than the ATC, the Orange ATC curve represents a loss because it's costing more than the firm is selling for, and the Red ATC is long-run equilibrium, breaking even
If there's profit to be made, more firms will enter the industry, leading to industry Supply increasing, or shifting to the right. As supply increases and Price decreases, profit also decreases, until the firms are breaking even and it is now in the long run. The opposite happens for profits making a loss.
Monopolies
- Unique product
- Potential to Price Discriminate
- Price making firms
- Only one large firm